About
This page contains the freely explorable flow cytometry data from the manuscript:
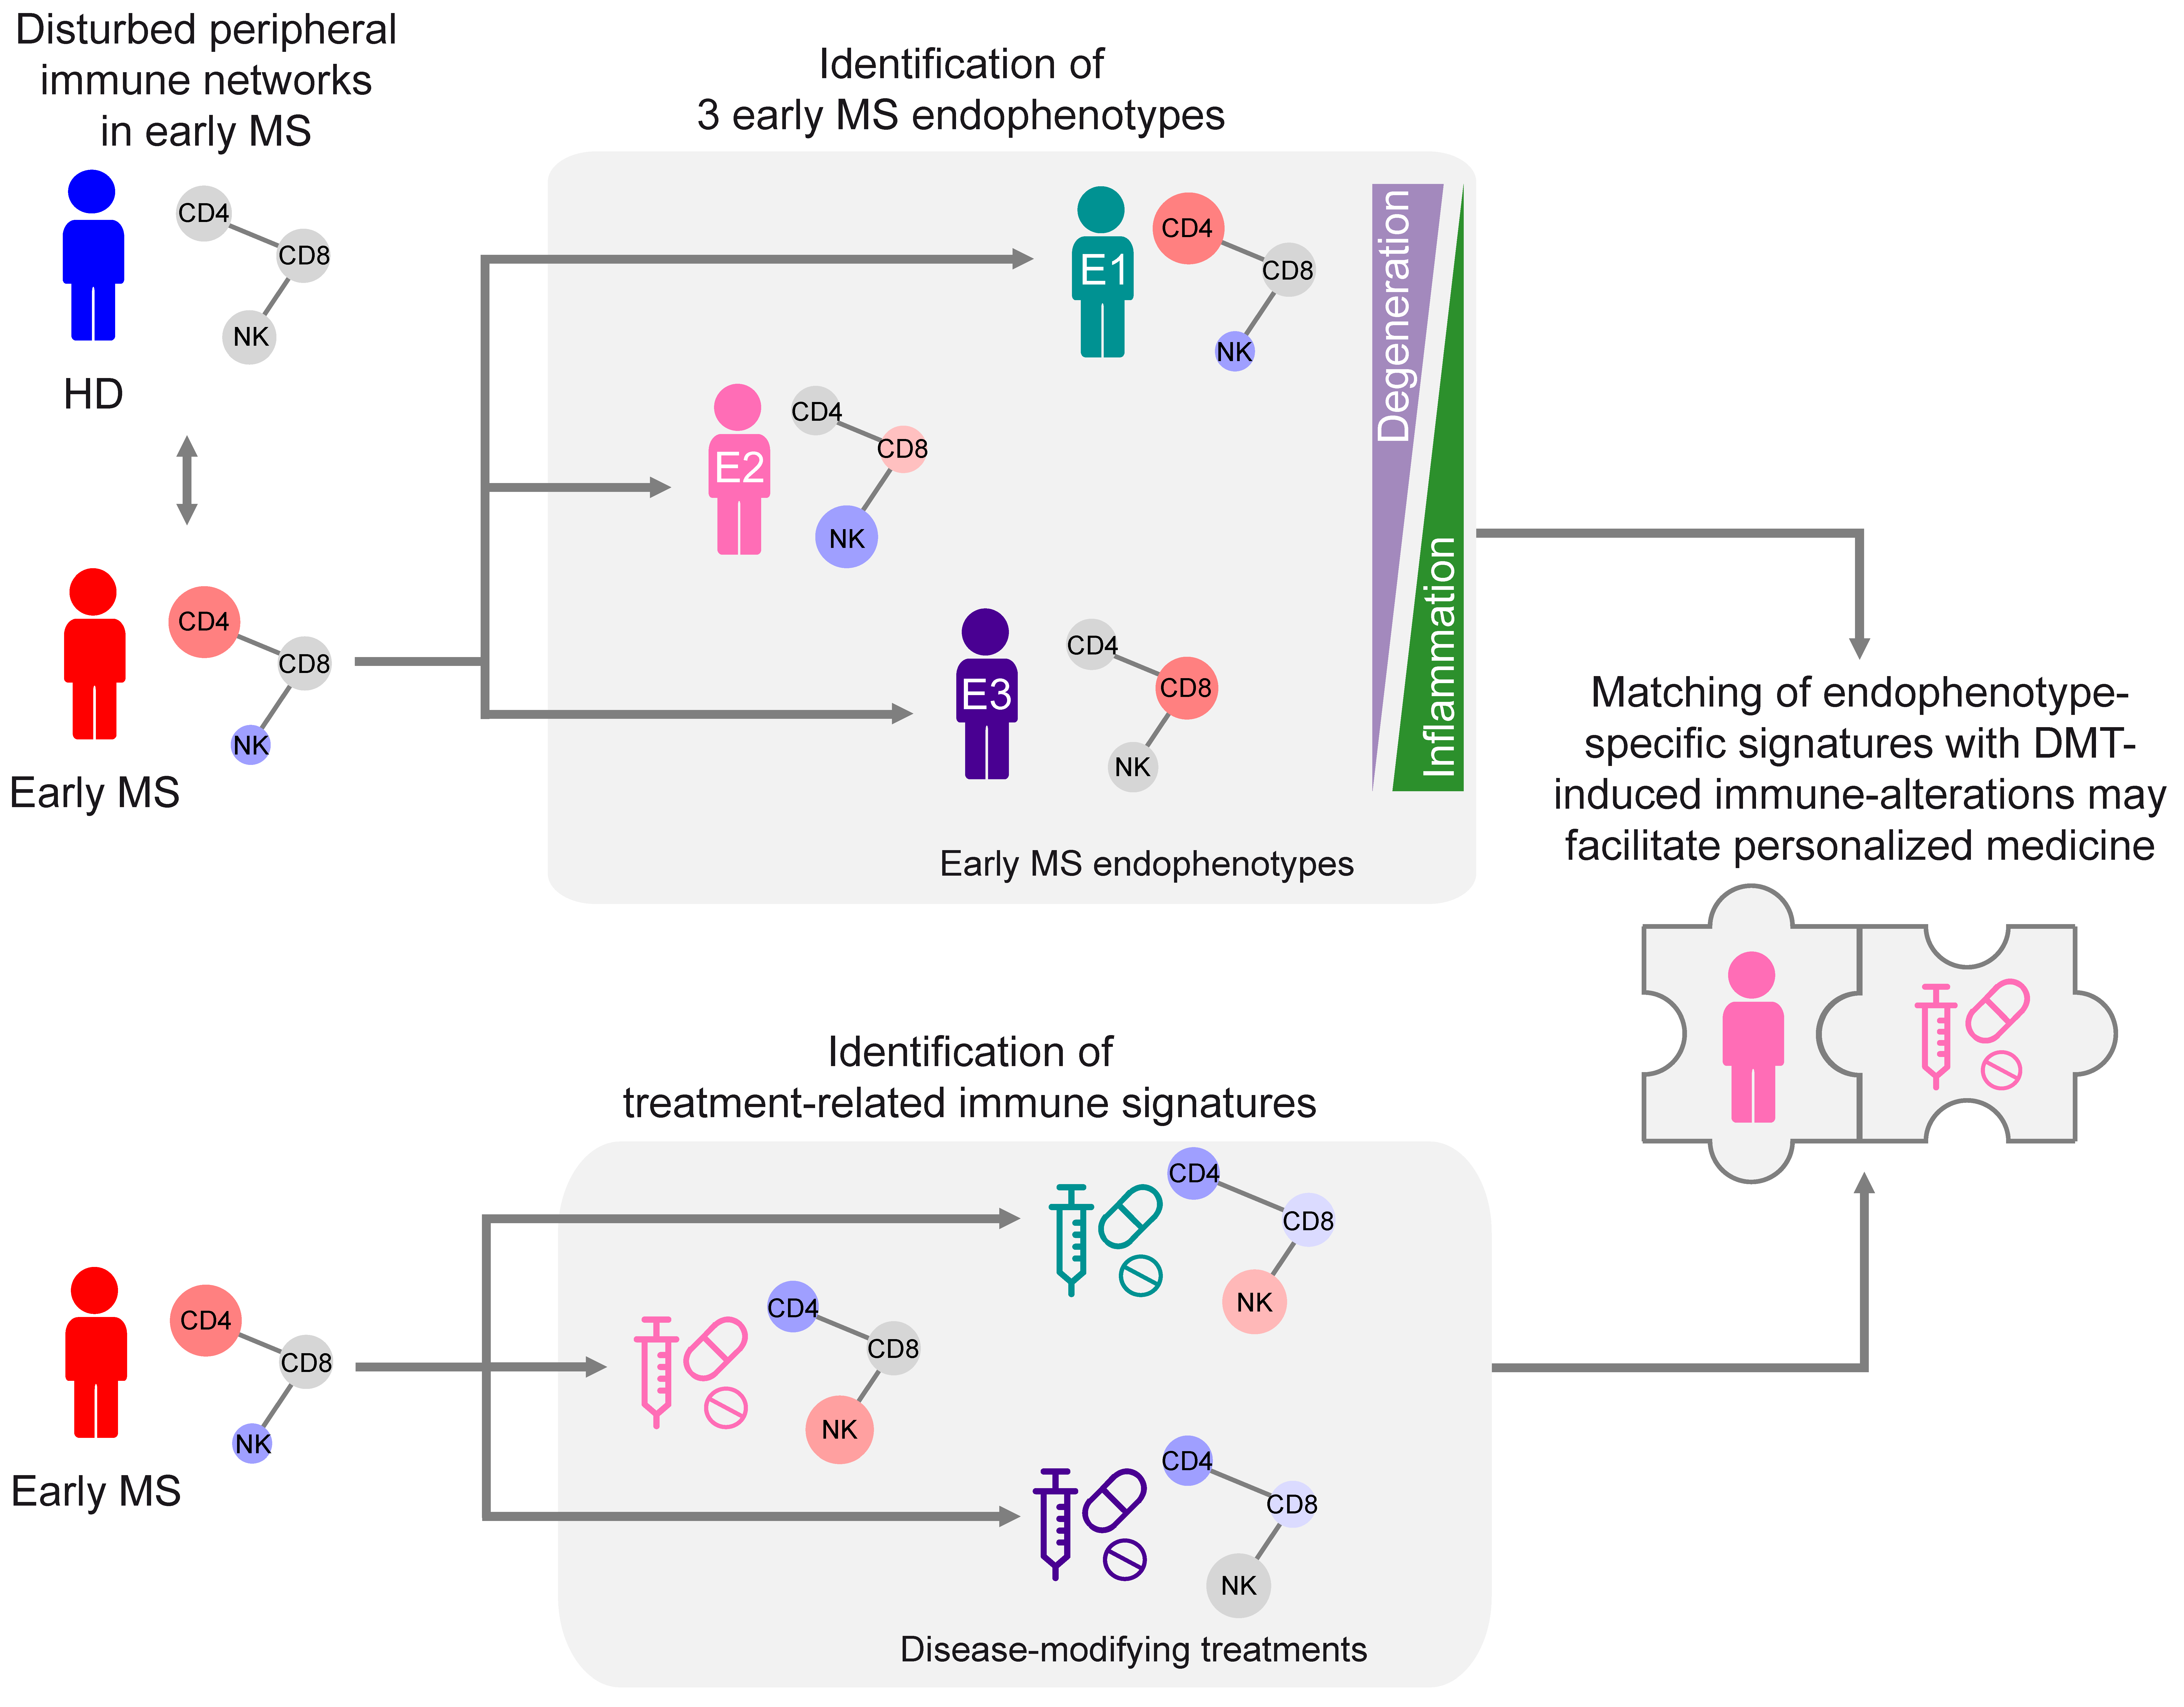
Multiple sclerosis endophenotypes identified by high-dimensional blood signatures are associated with distinct disease trajectories by Gross, Schulte-Mecklenbeck, Steinberg, Wirth and Lauks et al. DOI: 10.1126/scitranslmed.ade8560
Please cite the publication if you used this app or the included data for your research.
How to use
You can select patient groups that you would like to explore by clicking on a color-coded list-items on the left sidebar. For each list-item, five tabs with flow cytometry data networks will appear.
In these networks each node represents a distinct immune-cell subset. The color of the nodes corresponds to the log2 fold-changes of the median frequency ( increased , decreased ) of the immune-cell subset in comparison to healthy individuals. The border style of the nodes represents the respective p-value obtained using the Mann-Whitney test corrected for multiple comparisons by Benjamini-Hochberg (FDR) method.
A mouse click on each node produces a scatter-box-plot on the right with the underlying data for each individual. You can also move nodes, zoom in and out using your computer mouse, keyboard or navigation buttons below the network, and highlight specific nodes by compartment of interest using the drop-down menu above the network.
Details on markers and phenotypes
In each patient group, the first tab "Cell-subsets and effector functions" contains a network with manually-gated parameters. The short description of the gating strategy for each cell-subset appears above the boxplot upon selection of the node of interest.
The four "phenotype" tabs contain the parameters, obtained by an automated gating (clustering). The data was clustered panel-wise for each described immune-cell compartment. The "P" nodes stand for the flow cytometric "panel", and the numbered nodes stand for the clusters (cell-subsets), as defined by automated gating. For detailed descriptions of each cluster phenotype, select the cluster or the panel of your interest in the network and click the button "Show cluster phenotypes" that appears under the box-plot panel on the right.
Contact
Please contact the corresponding authors Heinz Wiendl: wiendl@uni-muenster.de or Luisa Klotz: luisa.klotz@ukmuenster.de or Catharina Gross: catharina.gross@ukmuenster.de if you have any questions.
Credit
This app was created using Shiny from RStudio v.2023.09.1.
The data networks were generated with visNetwork v.2.1.2.
The boxplots were generated with ggplot2 v.3.4.2.
Code by


